![MenuMetric_500_130.png]](https://support.menumetric.com/hs-fs/hubfs/MenuMetric_500_130.png?height=50&name=MenuMetric_500_130.png)
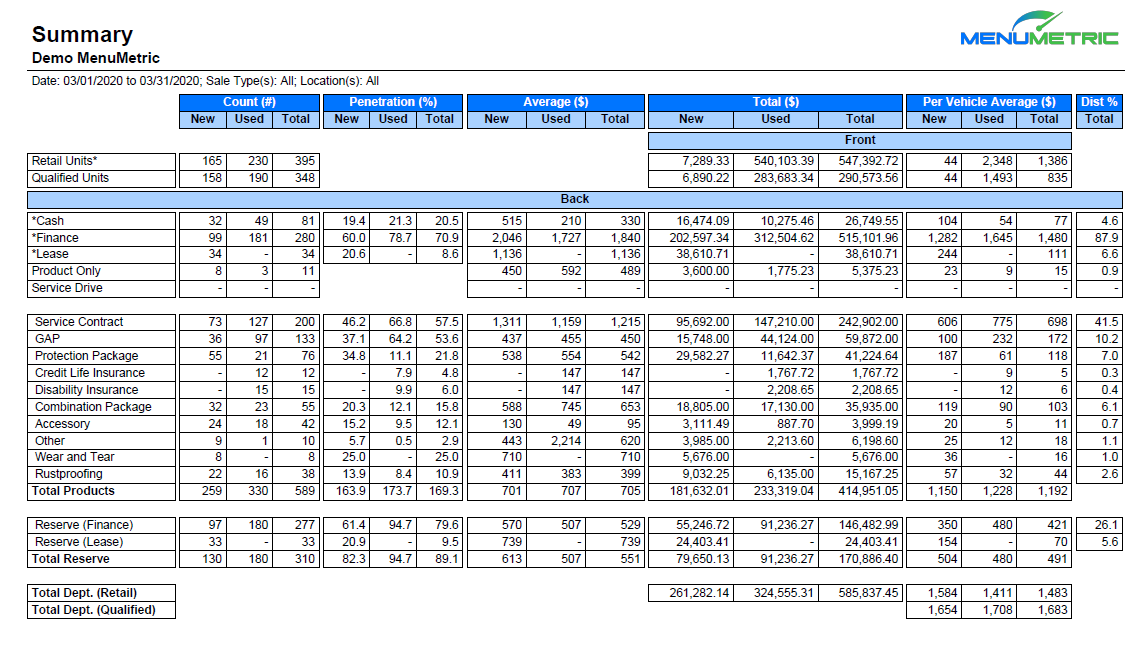
This report is set up into columns for Count, Penetration, Average, Total, Per Vehicle Average, and Dist %.
Count (#): The total count of New, Used, and Total sales for each category. In this example, the dealership sold 200 service contracts.
Penetration (%): This is the percentage of deals that have that sale type or product sold. The calculation for most product categories is the number sold divided by the Qualified Units. Example: 200 service contracts sold divided by 348 qualified deals is 57.5%.
The exceptions to this rule are GAP, which is the total sold divided by the number of Finance deals and Wear & Tear which is divided into the number of Lease deals.
Total Products penetration in this example is 169.3% which equates to 1.693 deals per product.
Average ($): Total ($) for that category divided by the number sold. In this example, Service Contract Total ($) $242,902 divided by 200 Service Contracts sold is $1,215.
Total ($): Total profit from each source. For Service Contracts, this number is $242,902
Per Vehicle Average ($): This represents the average per unit sold for each category. For each sale type and product category, the number represents what portion of the total deal average comes from that category. In this example, the total Per Vehicle Average on qualified units is $1,683. $696 of that comes from Service Contracts.
Dist %: Distribution Percentage. This represents the percentage of the total profit that comes from that sale type or product category. In the example below, Service Contracts show 41.5%. This is calculated by dividing $242,902 by the total profit of $585, 837.45.